Perfetto is kind of a weird tool because it seems to be designed around tracing Linux and Android but overwhelmingly it gets used because of their integration with the exceptionally simple JSON tracing format that takes like 2 seconds to implement in whatever tool you are using. This alone is profoundly useful and I greatly respect the impact they have had towards commoditizing "trace viewing". I've gotten so much mileage out of it because of that.
I understand that Google maintains and uses this tool for their own thing but I kind of wonder if the UI should just get split off into its own thing, because I get the impression that they don't even really particularly like supporting what everyone else is using it for. I know the maintainers are around here is around so perhaps they have more context but it's just very strange to me that the UI will always be showing things like "syscall trace" or "connect a device" when I am looking at GPU kernels or network spans. And I get the impression that the JSON format is considered to be kind of grandfathered in and not really what they like supporting. I guess in a sense it's a little weird that most of the people I know use it like the flamegraph viewer tool for traces but it views itself as the one-stop-shop for your Android performance profiling that just happens to have good import for recorded profiles.
Also, I repeat this a lot, but I think a lot of profiling tools could stand to learn things from Apple's Instruments. I don't really know what they are doing over there but their UI is almost always the best for actually finding what the problem is rather than just dumping data at you like what a lot of profiling tools do (especially for Linux). Notably it's had the "bottom up" view for a very long time because I assume the Apple engineers who work on like malloc use it a lot. It's even weirder and more proprietary in the ways I mentioned above while also not having any sort of import feature, so I understand why nobody seems to know about it or steal design ideas from it, but it's slept on. Arguably I don't even think people should be using it for general-purpose use because it's ironically slow and laggy in ways that Perfetto definitely isn't, but it is exceptionally good at common tasks like "zoom into this region" or "let me quickly jump to the part of this call stack that is a problem" that I have not seen anywhere else.
Does anybody have advice on how to embed perfetto UI into local tool? I'm currently using the old catapult chrome trace viewer to visualise and inspect scheduler outputs but there are some shiny features in perfetto that would be great.
Background: My company designs machines that automate medical laboratory tests. Many applications have a fun scheduling problem at their core, think 'job shop' with a bunch of biology-enforced constraints.
To help design these systems our tool allows an engineer to (a) enter a 'recipe' and resource constraints of a hypothetical system (b) use our fancy scheduling engine to simulate the system, (c) output a 'trace' of how each piece of equipment is scheduled and (d) display some basic statistics.
Currently this is implemented as a single .html file - the GUI is vanilla js, the scheduler is cross-compiled to wasm and embedded and the output trace json is injected into an iframe containing chrome trace viewer.
Because the design process is quite iterative, a single button press to run the simulation and display the output is desirable.
I understand that perfetto has chosen not to support embedding, fair enough. plugins seem to require hosting/maintaining my own fork. Any other ideas?
Perfetto is so nice.
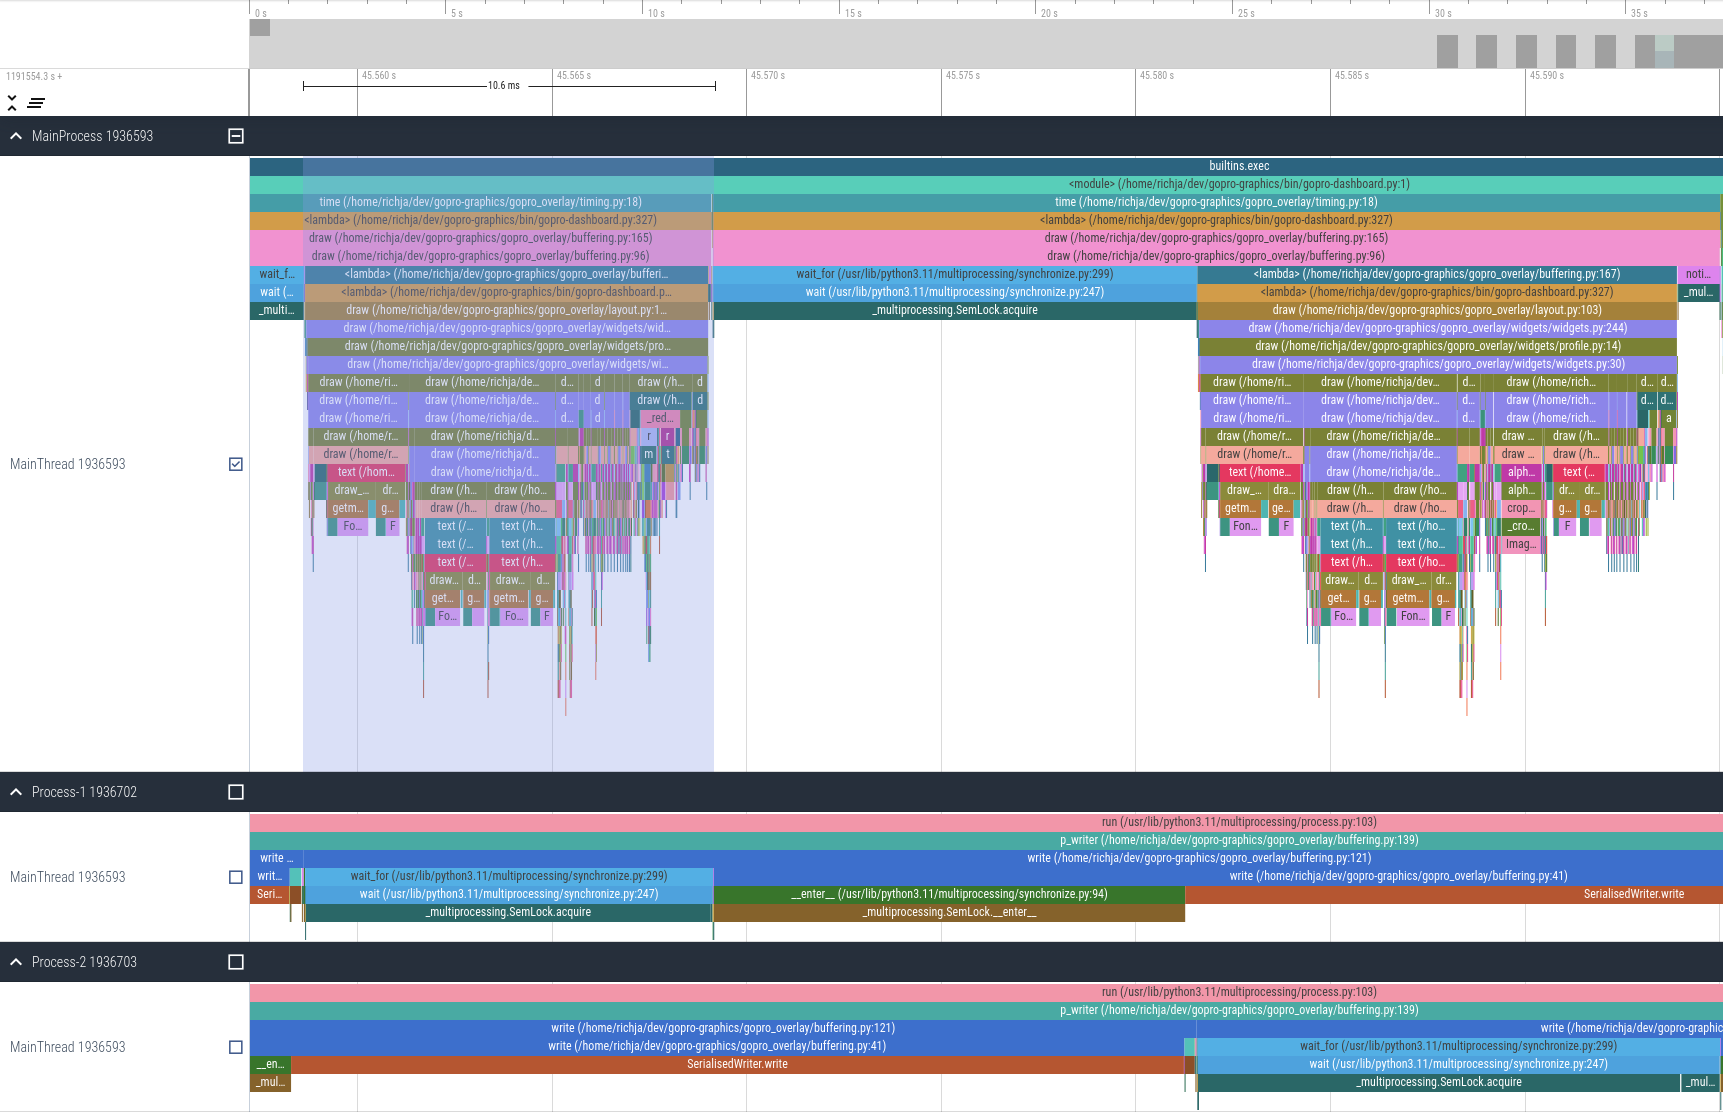
Viztracer is a super library to capture perfetto compatible output from Python.
It helped me find perf issues in literally minutes.
https://raw.githubusercontent.com/time4tea/gopro-dashboard-o...
Glad to see that there's support for CPU sample flamegraphs in Perfetto now that's on par with Google's internal pprof visualizer as alluded to in the talk. Using the internal visualizer to share Windows ETW traces with colleagues was the primary motivation for developing [EtwToPprof](https://github.com/google/EtwToPprof). Now that perfetto supports this natively, I might look into developing EtwToPerfetto :-)
SQL interface for querying traces is the real killer feature though.
This kind of thing always feels too slow to use. Every time I open my trace in it, it always lags and requires a few seconds to zoom in or zoom out.
How much overhead does the recording have?
I want to debug custom kernel filesystem issues on a 96 CPUs machine. My benchmark is building the Linux Kernel def config with make -j96. I have tried ftrace before but it's making everything 100x slower...
Something too complex; I fear I won't ever have enough time to try it and figure out how to apply it for it to be of any use for me.
I wish there was a simpler and quicker introduction into the tool's capabilities than an hour long video and a text article saying it's a swiss army knife that does a lot of things. I need 1 or a few glimpses into it, there's no need to cover every capability thoroughly, show just enough to have some general understanding of how it works and how to use it and how to solve some common problems with it.
Perfetto is definitely one of my favorite tools to use ever, thank you for working on it!
My personal favorite tool I've built this year is to dynamically generate a trace from a sql query, and allow quickly combining queries. Something like `SELECT timestamp, track, name, ` etc. where column names get transformed to packets automatically.
That way I can overlay multiple py-spy traces and instrumentation into a dynamically implemented generated perfetto trace, loaded into a perfetto iframe using the ping/pong mechanism at https://perfetto.dev/docs/visualization/deep-linking-to-perf....